About us

Ntico Logistics has been created by a number of experts, each sharing his know-how in the area of logistics productivity.

Logistics productivity is a permanent issue for all professionals. Distributors, industrials, 3PLs, … all share the same eagerness to optimize their handling and storage operations. – – The quest for logistics productivity has two major, yet simple reasons:

  • – The pursuit of lowest cost. This, most certainly, is the most obvious reason. Obtaining the best possible ratio for performance/cost.
  • The quest for better customer service. High productivity allows for shorter cycle times. Faster operations contribute to higher customer loyalty and help avoiding costs linked to not keeping up with promises.

Our method, PikXTRA, stands out by its ingenuity and innovative approach. We managed to combine years of practical logistics experience with optimization techniques and algorithms, stemming from metallurgical physics and genetic code research!

In France, Ntico Logistics has been awarded financial support by OSEO, the Region Centre and received the governmental qualifying label of “Young Innovative Start Up”.

Why we measure ?

Improved performance exists only if it is measurable … and effectively measured. All too often, optimization efforts are undertaken based solely on “good old common sense”.

PikXTRA produces a number of metrics allowing you to determine if a specific idea for improvement really has an acceptable probability to deliver.

Here are the main metrics (KPIs), used by PikXTRA to achieve significant performance wins:

  • Order picking distance

    Pretty easy to explain : the shorter the distance, the higher your performance during order picking.

  • The number of stops during a picking route

    In order to take a product from its picking location, your operator has to make a stop. Every stop generates a loss of time (slowing down, speeding up).

  • Replenishment of the picking locations

    More business means more order picking, inducing a need for more frequent replenishment of your picking locations.

  • Ergonomics

    Pulling products from high are low locations is a strain on your back!

  • Order picking distance

KPI: Distance per order line.


In case the products are put on pallets, the picking route consists of 5 parts :

  1. Driving distance between the stack of empty pallets and the first pick point.
  2. The distance covered in the picking area.
  3. Driving distance between the last pick point and the wrapper.
  4. Driving distance between the wrapper and the shipping ramp.
  5. Driving distance between the shipping ramp, back to the stack of empty pallets.

PikXTRA will measure each of these distances for every pick run, such as they currently are executed in your warehouse, as well as in the optimized slotting version.

Any difference in distance (on a weekly basis) can be expressed in worked hours and be considered as potential savings.

Example:

A reduction of 100km/week would mean a saving of +/- 35 worked hours (accepted that your order picker progresses at an average speed of 3 km/h).

  • Number of stops

KPI: Number of order lines picked per Stop.


Making a stop generates a loss of time, based on the following :

  • Slowing down,
  • Stepping down from your engine,
  • Getting up, one the product has been picked,
  • Speeding up again.

In this situation, the order picker has to take products from 3 locations.

As a consequence, (s)he has to make 3 stops.

As such, (s)he has made 3 stops for 3 order lines.

(Number of order lines / Number of Stops) = 3 / 3 = 1

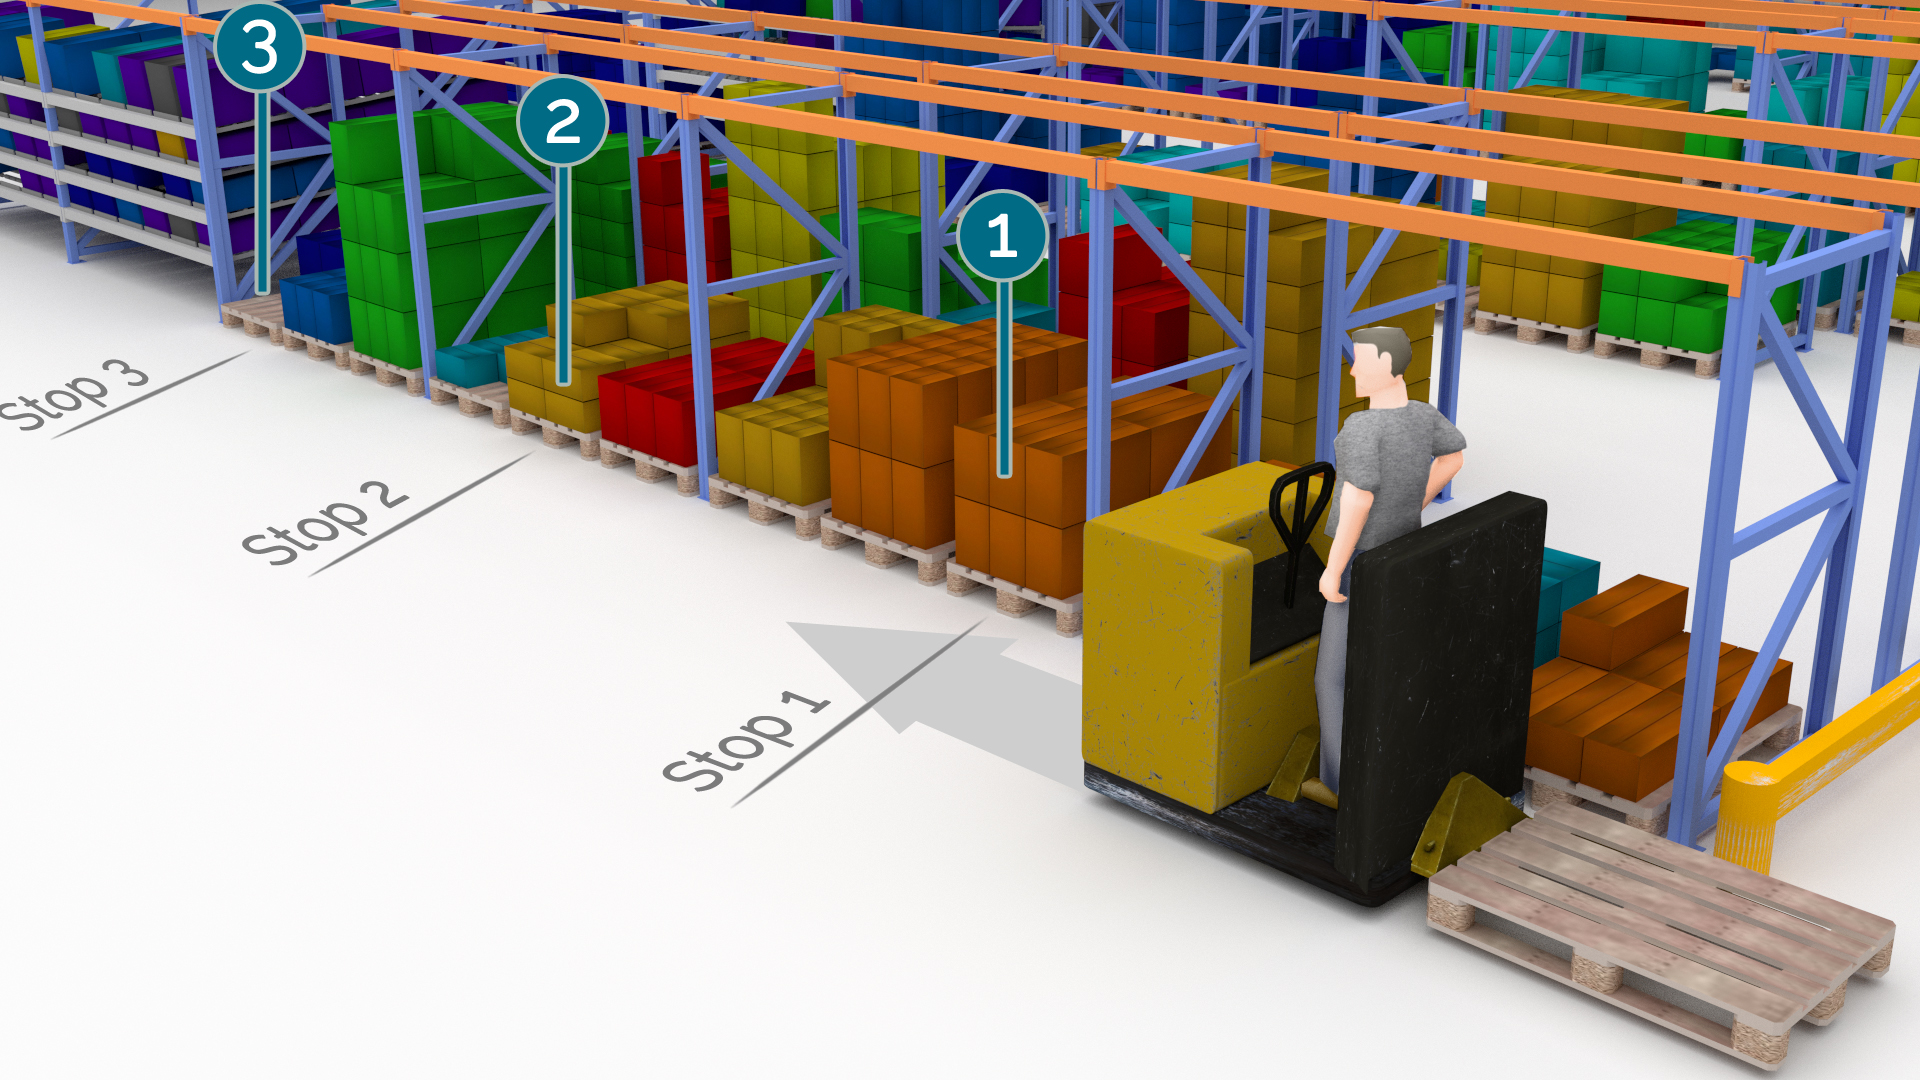
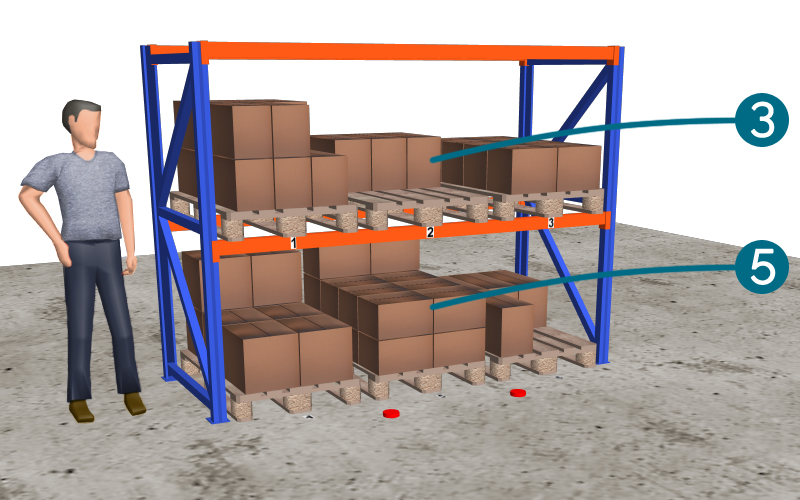
In this situation, the order picker also has to take products from 3 locations.

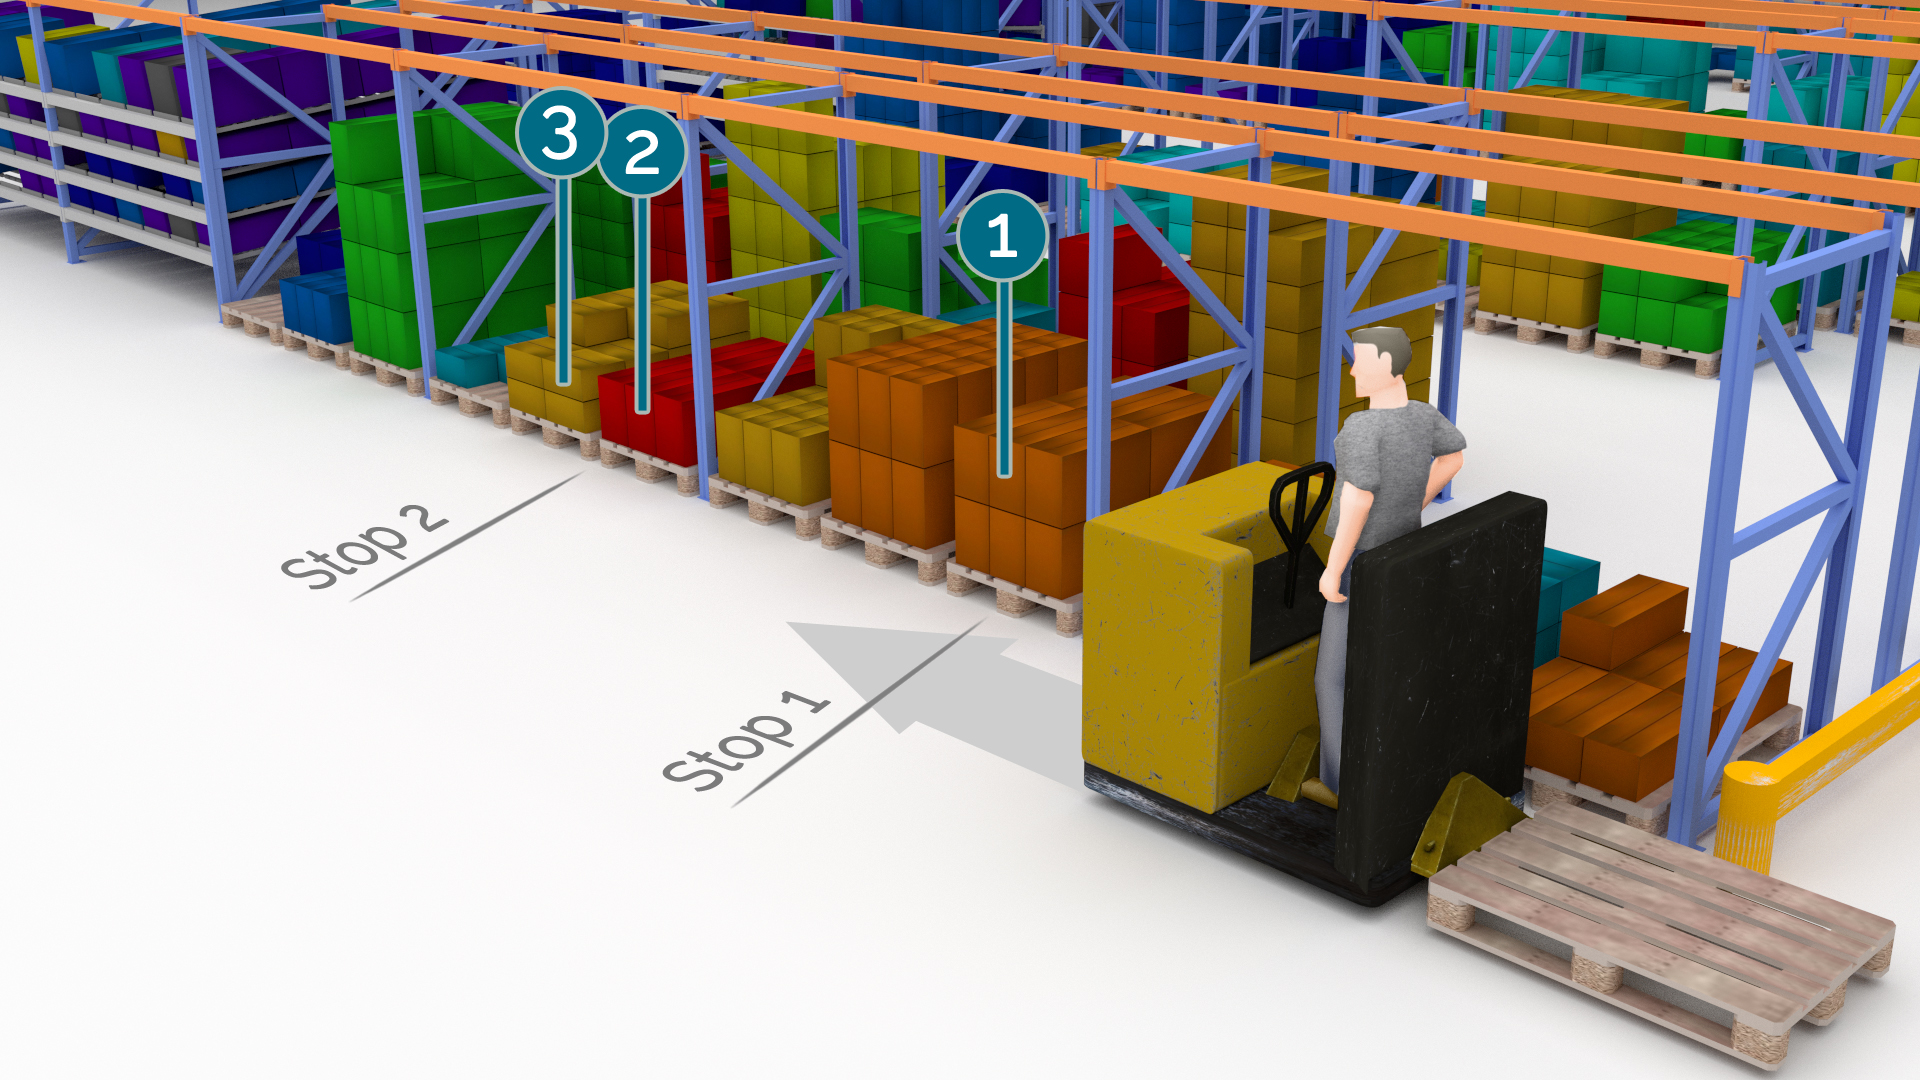
In this case however, after stopping on location 2, the order picker will not move his (her) pallet to pick on location 3.

As such, (s)he has made only 2 stops for 3 order lines.

(Number of order lines / Number of Stops) = 3 / 2 = 1.5


The higher this ratio, the fewer stops are necessary.

Taking that one Stop generates a loss of 5 seconds, you can save 35 worked hours by reducing 25 000 Stops.

  • Replenishment of picking locations

KPI: number of replenishments for every 1 000 order lines.


When calculating, PikXTRA will count one replenishment every time a picking location is emptied during picking activity.

Exemple :

A picking location has a capacity of 80 boxes.
During the week, a total of 240 boxes has been picked.
Therefore, this location will have to be replenished 3 times (240 / 80).

Good to know :

Generally, a replenishment is triggered when the inventory at the picking location reaches a threshold. PikXTRA will make its calculations with all thresholds = 0.
Consequence: your effective number of replenishments will always be higher than the number calculated by PikXTRA.

  • Picking ergonomics

KPI: our ergonomics index EoPi.

(EoPI = Ergonomy of Picking Index)

Within the 3D map of your warehouse locations, PikXTRA, foresees a “painfulness” index for every location.


Flow rack locations between knee and shoulder levels will bear index 1.


Locations at the top receive index 2, bottom locations get index 3.

Every picking line will be evaluated by its index as well as the weight of the product.

The calculation is made such a way that warehouses with only full pallet locations will have an EoPi of 200.

Warehouses with intermediary beams will obtain an EoPI, exceeding 200.

Calculating an optimization


When optimizing your slotting, PikXTRA has the capacity to simultaneously improve all 4 KPIs. This way, you can get better on all levels.

What’s more :

In certain warehouses, it could be wise to give a higher importance to some of these metrics.

In such case, we can attribute a higher weight to this KPI in order to obtain the desired effect.

PikXTRA also provides a regular follow-up of these KPIs. This allows you to check your progress and to maintain the improved performance.

Shopping Basket